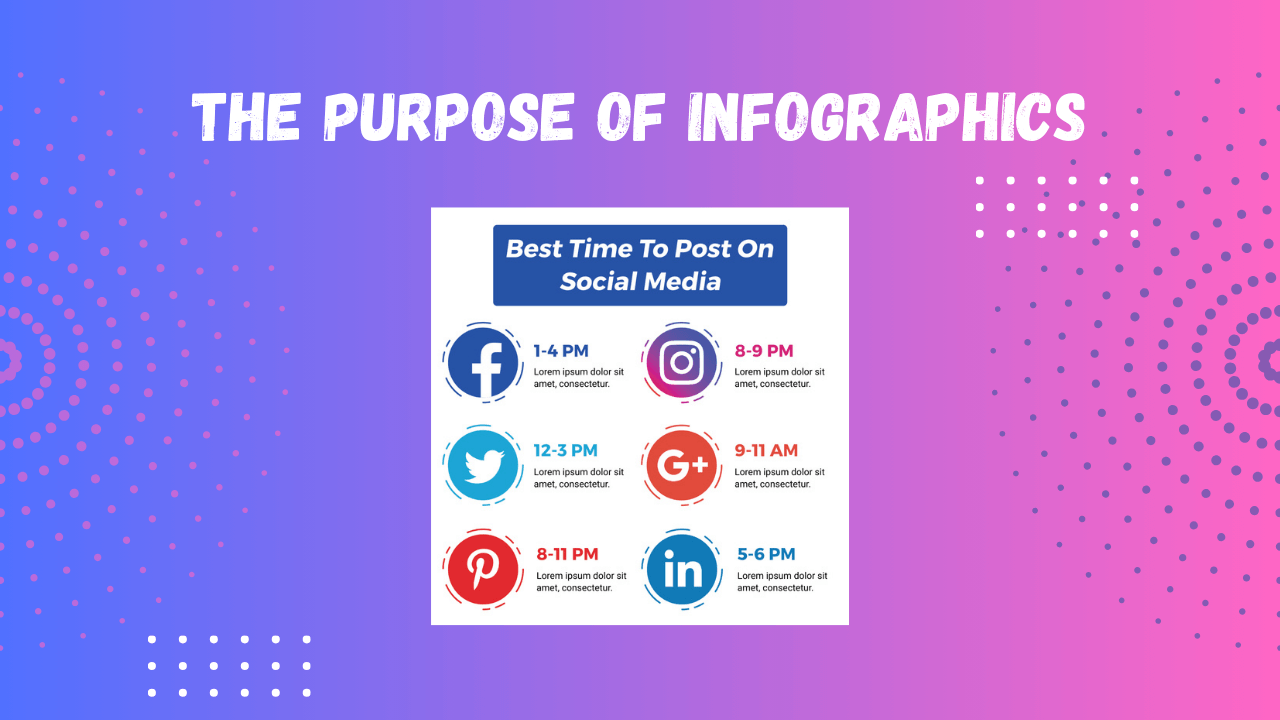
In our increasingly fast-paced and information-rich society, the ability to convey complex ideas quickly and effectively is paramount. Enter infographics – powerful visual tools designed to distill information into a visually compelling format. This article explores the purpose of infographic templates and how they contribute to effective communication in a world dominated by visuals.
The Purpose of Infographics
I. Visual Appeal and Accessibility:
Infographics leverage the innate human ability to process visual information rapidly. By combining text, images, and design elements, they create a visually appealing narrative that captures attention and makes information more accessible. This is particularly crucial in an era where attention spans are dwindling, and information overload is common.
II. Simplifying Complexity:
One of the primary purposes of infographics is to simplify complex data or concepts. Through the strategic use of icons, charts, and graphs, intricate information can be presented in a digestible manner. This simplification not only aids in understanding but also facilitates quicker decision-making.
III. Enhancing Retention and Engagement:
Studies show that people remember information better when presented in a visual format. Infographics enhance retention by creating a memorable association between content and visuals. Additionally, they foster engagement by providing a more interactive and enjoyable learning experience.
IV. Storytelling and Narrative:
Infographics are a powerful storytelling tool. By combining data points into a coherent narrative, they guide the viewer through a structured and logical flow of information. This narrative approach helps convey the intended message effectively and ensures that the audience grasps the key takeaways.
V. Versatility in Communication:
Infographics are versatile and can be employed across various platforms – from social media and presentations to reports and educational materials. Their adaptability makes them an ideal choice for communicating diverse information to different audiences.
VI. Branding and Recognition:
Beyond conveying information, infographics play a role in branding. A well-designed infographic can become synonymous with a brand, creating a visual identity that fosters recognition. This branding extends the reach and impact of the information being presented.
VII. Data Comparison and Analysis:
Infographics excel at presenting data comparisons and analyses. Whether through side-by-side comparisons, bar charts, or other visual elements, they enable viewers to quickly grasp trends, differences, and relationships within complex datasets.
VIII. Time and Resource Efficiency:
In a fast-paced world, where time is of the essence, infographics offer a quick and efficient means of information consumption. They allow individuals to glean essential insights without having to sift through lengthy paragraphs, making them a time-saving resource.
IX. Global Accessibility:
Infographics transcend language barriers. Through the universal language of visuals, they can convey information to a global audience without relying heavily on written text. This makes them an ideal choice for disseminating information across diverse cultural and linguistic backgrounds.
X. Social Media Shareability:
In the age of social media, infographics are highly shareable content. Their visually appealing nature encourages users to share them on various platforms, amplifying the reach of the information. This shareability factor is particularly advantageous for content creators and marketers.
XI. Decision Support:
Infographics are not just about presenting information; they can also serve as decision support tools. By presenting key data points and insights in a clear, concise manner, they assist individuals in making informed decisions, whether in business, education, or personal contexts.
XII. Evolving Technology Integration:
Advancements in technology have allowed for dynamic and interactive infographics. Features such as clickable elements, animations, and responsive designs enhance the user experience, enabling a more immersive and engaging interaction with the information.
XIII. Educational Aid:
In educational settings, infographics serve as effective teaching aids. They break down complex subjects into visually appealing modules, catering to diverse learning styles. Teachers and educators find infographics valuable for engaging students and conveying information in a memorable way.
XIV. Real-time Data Visualization:
For industries where real-time data is crucial, infographics provide a means to visualize changing trends instantly. Whether tracking market fluctuations, social media metrics, or any other dynamic data, infographics offer a real-time snapshot of information.
XV. Advocacy and Awareness:
Infographics play a significant role in advocacy campaigns and raising awareness. By condensing key messages into visually striking graphics, they can evoke emotions, garner support, and drive social change.
Conclusion
In an era dominated by information overload, infographics serve as invaluable tools for effective communication. Their ability to distill complex ideas, enhance visual appeal, and facilitate engagement makes them essential in a world where attention is a scarce commodity. As we navigate an increasingly visual landscape, understanding the purpose of infographics becomes crucial for communicators, educators, and businesses alike.


